
Project Title: Redesigning Solar Energy Data Visualization: Showcasing Global Solar Power Production
Objective:
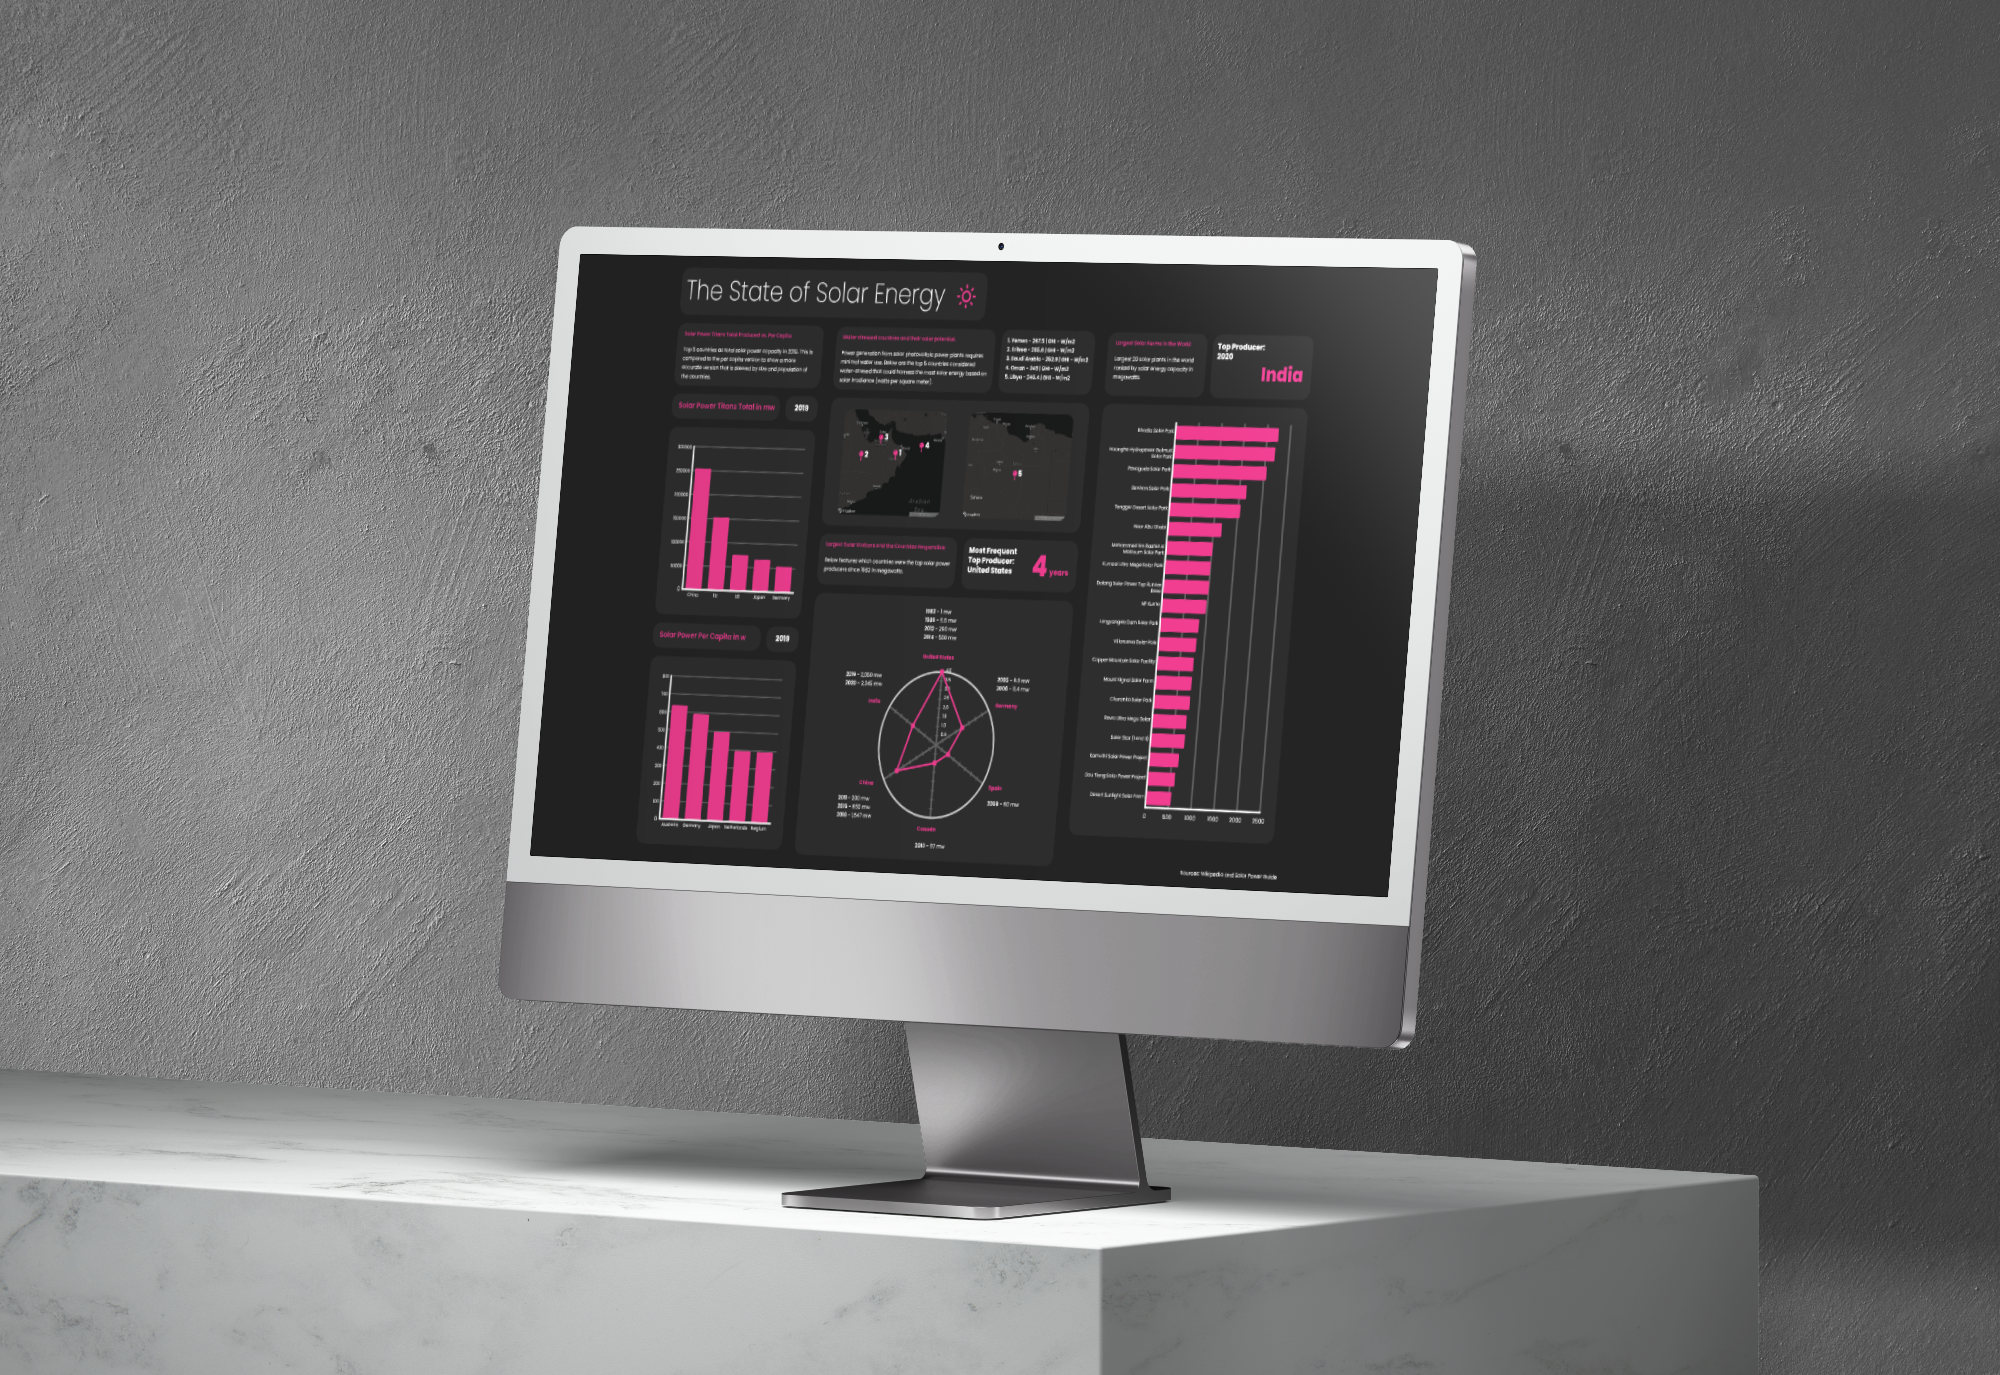
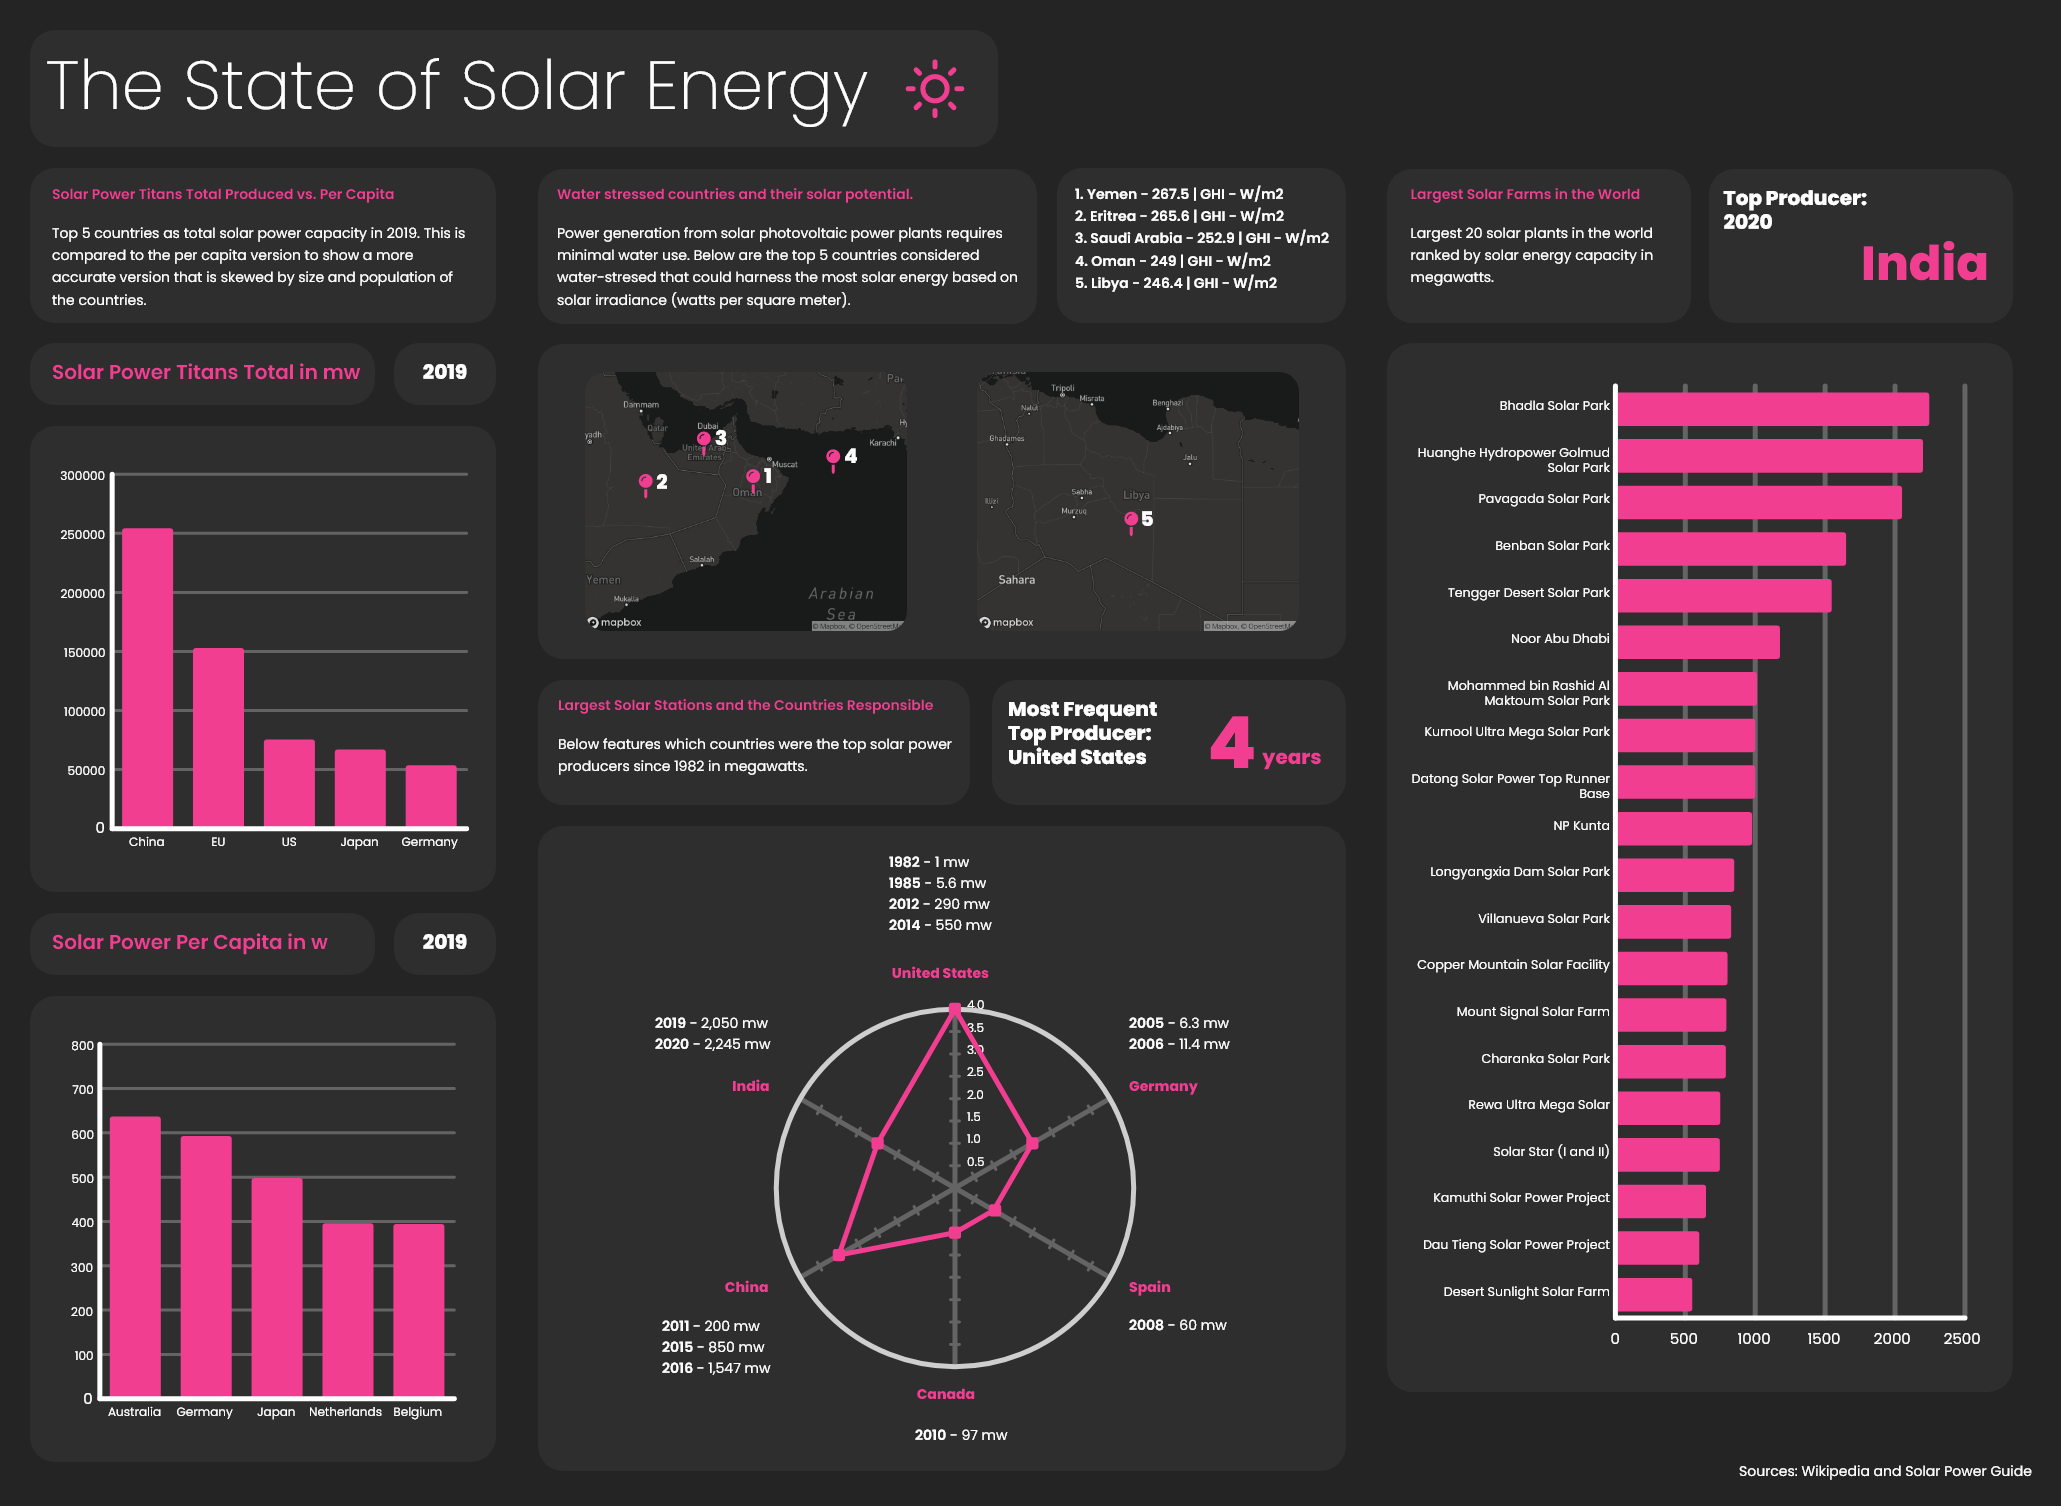
The objective of this project was to reimagine and redesign an existing data visualization related to solar energy. The visualization aimed to showcase the countries prominently producing solar power and provide a comparative analysis of their contributions to renewable energy, utilizing pre-existing and cleaned data.
Scope:
The project focused on redesigning the visual representation of solar energy data. The primary goal was to present the solar power production by different countries in an original and visually compelling manner, while utilizing the provided and cleaned data.
Key Features and Achievements:
1. Visual Redesign: The project involved creating a fresh and original design for the solar energy data visualization. Attention was given to aesthetics, color schemes, and layout to ensure an engaging and visually appealing presentation that effectively communicated the solar power production by different countries.
2. Comparative Analysis: The redesigned visualization enabled viewers to compare the solar power production among various countries. It highlighted the leading nations in solar energy generation and presented their relative contributions to the renewable energy landscape in a clear and visually impactful manner.
3. User-Friendly Interactivity: The redesigned visualization incorporated interactive elements to enhance the user experience. Users could engage with the visualization to explore specific country details, compare multiple countries side by side, and gain deeper insights into solar power production trends.
4. Information Utilization: The project leveraged pre-existing and cleaned data to create an original visualization. By utilizing the provided data effectively, the redesign aimed to present the solar energy information in a more visually engaging and comprehensible format.
Outcomes and Impact:
1. Enhanced Visual Appeal: The redesigned solar energy data visualization successfully captured the attention of viewers with its fresh and original design. By presenting the data in a visually appealing manner, it increased engagement and improved the overall user experience.
2. Comparative Insights: The visualization provided valuable insights into the countries leading in solar power production. By showcasing their contributions and allowing for easy comparison, it facilitated a better understanding of the global landscape of renewable energy generation.
3. Promoting Sustainable Energy: The project's focus on solar power production aimed to raise awareness and promote the importance of renewable energy sources. By redesigning the visualization, it aimed to inspire and encourage the adoption of solar technologies for a more sustainable future.