
Objective:
The objective of this project was to create a compelling digital data journalism piece that shed light on the factors contributing to the decline of the bee population. The project aimed to present a comprehensive overview of the issues impacting bee populations, with a specific focus on neonicotinoid usage in agriculture. Additionally, the project aimed to develop a digital framework for displaying interactive data, making complex scientific information accessible and concise for a layperson audience.
Scope:
To achieve the project's objective, extensive research and data collection were conducted from various sources, including government databases and environmental firms. The project encompassed data cleaning and visualization using both Tableau and Python. The focus was on employing user experience (UX) and data visualization methodologies to create an interactive and engaging digital platform for presenting the information.

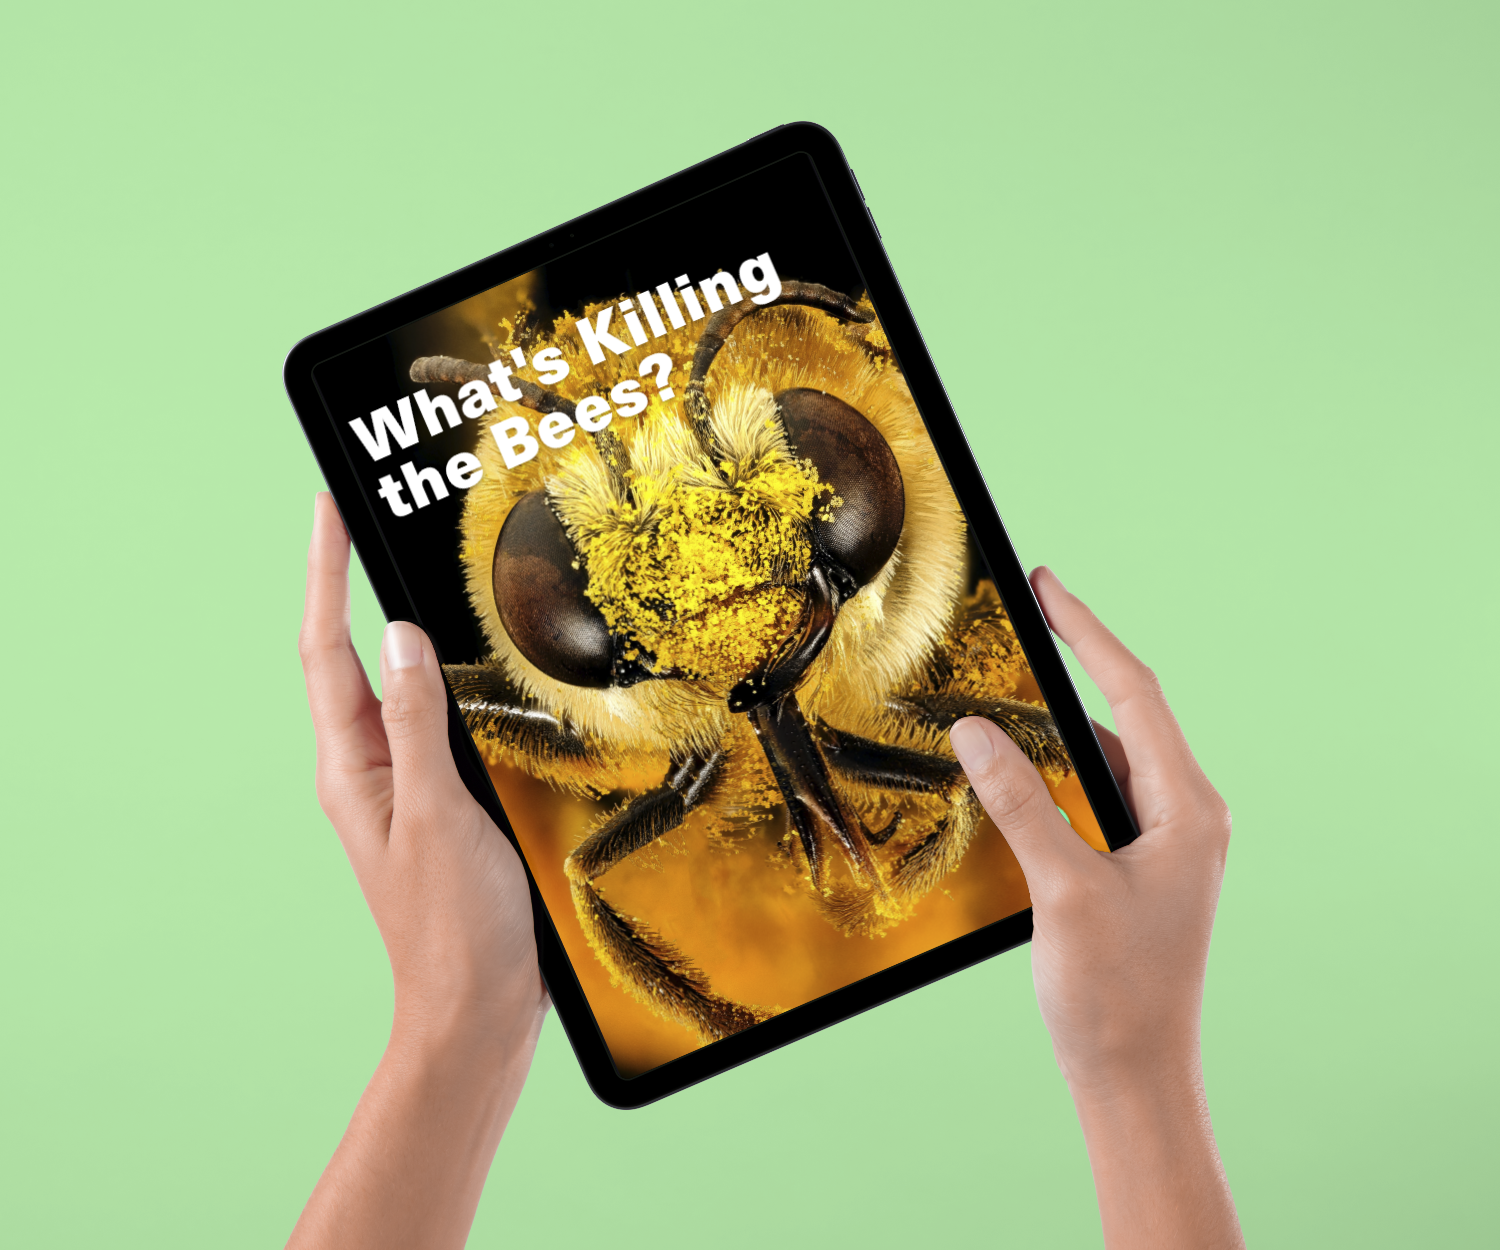
Project Title: Decline of Bee Population: A Digital Data Journalism Initiative
Scope:
To achieve the project's objective, extensive research and data collection were conducted from various sources, including government databases and environmental firms. The project encompassed data cleaning and visualization using both Tableau and Python. The focus was on employing user experience (UX) and data visualization methodologies to create an interactive and engaging digital platform for presenting the information.
Key Features and Achievements:
1. Comprehensive Data Gathering: The project involved extensive data collection from diverse sources, ensuring a thorough exploration of the factors impacting bee populations. Government databases and environmental firms were consulted to gather reliable and up-to-date information.
2. Data Cleaning and Visualization: The collected data underwent a rigorous cleaning process to ensure accuracy and consistency. It was then visualized using both Tableau and Python, enabling the creation of interactive and visually engaging data visualizations.
3. UX and Data Visualization Methodologies: The project incorporated user experience (UX) and data visualization methodologies to design a digital framework that facilitated intuitive and accessible exploration of the information. The interactive features enhanced user engagement and understanding of the complex scientific concepts related to bee population decline.
4. Compelling Presentation: The digital data journalism piece aimed to captivate and inform a layperson audience. It employed storytelling techniques, visually appealing graphics, and concise explanations to convey the dense scientific information in a compelling and approachable manner.
Outcomes and Impact:
1. Increased Awareness: The project successfully raised awareness about the decline of the bee population and the multifaceted factors contributing to this issue. By presenting the information in an engaging and accessible manner, it reached a broader audience and fostered a deeper understanding of the importance of bee conservation.
2. Information Accessibility: The digital framework developed for displaying interactive data served as a model for future digital journalism applications. By demonstrating how to present complex scientific information in a concise and user-friendly manner, the project paved the way for more accessible and impactful reporting.
3. Advocacy for Sustainable Agriculture: The project's focus on neonicotinoid usage in agriculture highlighted the need for sustainable farming practices. By showcasing the impact of agricultural practices on bee populations, it aimed to advocate for more environmentally friendly approaches and promote the conservation of pollinators.
